The US Strategic Petroleum Reserve (SPR) is the world’s largest supply of emergency crude oil, with a storage capacity of 714 million barrels in four underground salt caverns along the Gulf Coast, as per the US Department of Energy.
US now world's largest oil producer, rewrites energy map as output hits record high
Record US production reshapes global crude trade and strengthens Washington’s clout
Last updated:
3 MIN READ
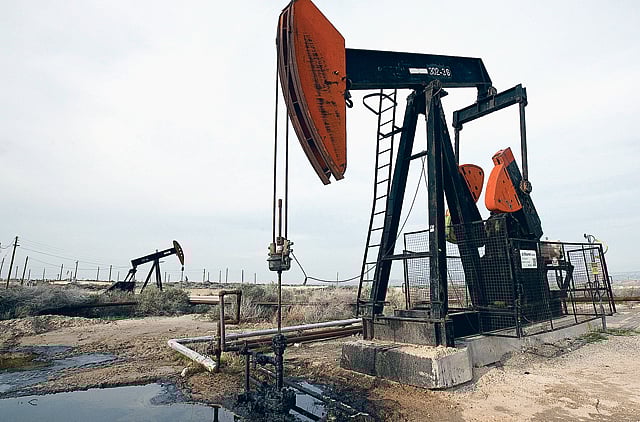
An oil well in California operated by Chevron Corp, the No. 2 US shale oil producer. US oil production, measured by energy content, climbed above 10,000 terawatt-hours a year, based on latest data.
Bloomberg News
The United States has cemented its position as the world’s largest oil producer, with output rising sharply since the shale boom and reaching a new record high, according to Energy Institute data compiled by Our World in Data.
US oil production, measured by energy content, climbed above 10,000 terawatt-hours a year in the latest data, pulling decisively ahead of Saudi Arabia and Russia, which each produced about 6,000 terawatt-hours annually.
The trend marks a dramatic reversal from the 1990s and early 2000s, when US oil output steadily declined and the country relied heavily on imported crude.
Production began rising rapidly after 2010 as hydraulic fracturing and horizontal drilling unlocked large volumes of oil from shale formations, particularly in Texas’ Permian Basin, as well as fields in North Dakota and other states.
Get it: Fast, verified news for FREE ... download the Gulf News app — simply click here
The United States’ production increase, as cited in a White House X (@RapidResponse47) post, has reshaped global oil trade, reduced the country’s dependence on foreign crude and turned it into a major exporter of oil and refined petroleum products.
It has also given Washington greater influence in a market long dominated by Middle Eastern producers and Russia.
Saudi Arabia and Russia remain among the world’s biggest producers and key members of the OPEC+ alliance, which has repeatedly adjusted output targets in an effort to support prices and manage supply.
Output bump
But the chart shows that neither country matched the scale of the US production expansion over the past decade.
US output rose from roughly 3,500 terawatt-hours in the late 2000s to more than 10,000 terawatt-hours in the latest Energy Institute data.
That puts American production around two-thirds higher than Saudi Arabia’s or Russia’s annual output on the chart’s energy-equivalent measure.
Canada has also emerged as a larger producer, with output rising toward 3,500 terawatt-hours a year, aided by oil sands development and export infrastructure.
Iraq and the United Arab Emirates have increased production as well, though at substantially lower levels than the three largest producers.
Centre of gravity in the oil market shifts
The data illustrates how technological advances, infrastructure investment and global demand have shifted the centre of gravity in the oil market.
While OPEC+ decisions still move prices and influence available supply, rapid growth in US shale production has made the United States a central force in balancing world oil markets.
The chart draws on the Energy Institute Statistical Review of World Energy 2026 and measures oil production in terawatt-hours per year, allowing output volumes with different energy content to be compared on a common basis.
The visualisation covers annual production trends from 1990 through the latest available data.
Fact file:
The United States is the world’s largest oil producer, with annual output exceeding 10,000 terawatt-hours in the latest data.
US production fell through much of the 1990s and early 2000s before accelerating after 2010.
Saudi Arabia and Russia remain major producers, at roughly 6,000 terawatt-hours each in the latest charted period.
Canada’s oil output has grown strongly, while Iraq and the United Arab Emirates have also expanded production.
The data underscores how the US shale boom altered oil trade flows and tilted the balance with leading OPEC+ producers.
Sign up for the Daily Briefing
Get the latest news and updates straight to your inbox
Network Links
GN StoreAbout Gulf NewsTerms & ConditionsReach by GNSitemapContact usPrivacy PolicyGN FocusHave your sayWork with usAdvertise with usGulf News epaperPrinting Services
Download our app
© Al Nisr Publishing LLC 2026. All rights reserved.