Boom and bust by the book
The credit crunch demonstrated to perfection the Austrian School's theories of business cycles. And now their theories predict more pain for investors
Before the Great Depression got under way, members of the Austrian school of economics developed a theory of business cycles. For the Austrians, things go wrong when a central bank sets short-term interest rates at artificially low levels. Such rates fuel credit booms.
In consequence, businesses overestimate the value of long-lived investments and an investment-led boom ensues — where a plethora of investment dollars is locked up into excessively long-lived and capital-intensive projects.
Investment-led booms sow the seeds of their own destruction. The booms end in busts. These are punctuated by bankruptcies and a landscape littered with malinvestments made during the credit booms. Many of these malinvestments never see the light of day.
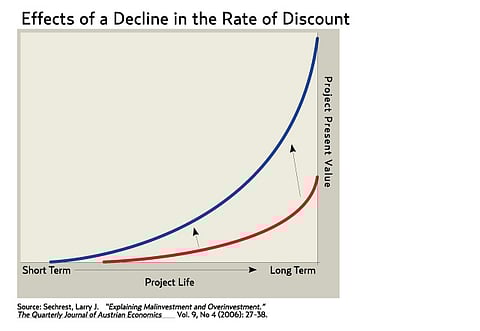
The accompanying chart depicts how, given the length of a project's life, a decline in the discount rate pumps up the present value of a capital project. An artificially low interest rate alters the evaluation of projects — with longer-term, more capital-intensive projects becoming more attractive relative to shorter-term, less capital-intensive ones.
Austrian theory played out to perfection during the most recent boom-bust cycle. By July 2003, the Federal Reserve had pushed the federal funds interest rate down to what was then a record low of 1 per cent, where it stayed for a full year. During that period, the natural (or neutral) rate of interest was in the 3-4 per cent range. With the fed funds rate well below the natural rate, a credit boom was off and running. And as night follows day, a bust was just around the corner.
Aiming high
The bust has manifested itself in various forms. Skyscrapers are relatively capital-intensive buildings. Not surprisingly, artificially low interest (or discount) rates make skyscrapers look attractive relative to shorter buildings. In consequence, skyscraper construction follows the rhythm of Austrian cycles: during a credit boom, skyscrapers are built and their completion typically coincides with a bust.
The busts have usually spelled long periods of trouble for the world record-setting skyscrapers. There is no better account of skyscraper troubles than James Grant's classic of 40 Wall Street's woes. In The Trouble with Prosperity, Grant wrote: "Forty Wall Street was a losing proposition (as, indeed, were most boom-era skyscrapers) even after the Bank of Manhattan helpfully stepped forward to take up enough extra space to bump up its annual rent bill to $1 million from $690,000. The trouble lay with the world at large. Incomes were shrinking, but the skyscraper's debt-heavy capital structure was unyielding; debts assumed in good times were due and payable in bad times, too. At $6 a square foot, 40 Wall would have generated revenues of $4.7 million a year when fully occupied. It needed $3.9 million a year just to break even. It is testament to the height of the boom and the depth of the bust that $3.9 million of revenues were first earned in 1952."
As Grant recounts, prior to the 1952 break-even date, bankruptcy visited 40 Wall Street. "Rents, of course, were gravity-prone in the extreme. Not so the funds due to the city in property taxes, to the fee holders in ground rent, and to the bondholders in interest, and the corporation proceeded to default on each of these obligations in the spring of 1939. Formal bankruptcy proceedings were completed in the next year." And in 1940, the value of the building was little more than half its 1930 cost.
If 40 Wall Street and other record-setting skyscrapers are a guide, we could be in for a Hayekian hangover. This condition — after the Nobelist Friedrich Hayek, a leading architect of Austrian cycle theory — follows a boom-bust cycle, and most painfully visits the most capital-intensive projects built during booms.
Moving to the United States, the spread between Baa and Aaa corporate bond yields has dropped from its peak of 350 basis points at the end of 2008 to under 120 basis points. The narrowing of this spread is the largest since the 1930s. As the accompanying table signals, the United States should have entered a boom. Indeed, if the annualised real growth rates in the next two quarters (Q4 2009 and Q1 2010) don't hit 7 per cent, we will know that the Obama administration's interventionist policies have been a bust.
Steve H. Hanke is a professor of Applied Economics at The Johns Hopkins University in Baltimore and a Senior Fellow at the Cato Institute in Washington, D.C.


