
DUBAI: Health experts, policymakers and citizens are all watching the coronavirus reproductive number (called R0, or R zero, aka R=nought) closely. But what is it?
What does it mean, really?
There’s so much going for the ‘R’ ("reproductive number"). In the case of the novel coronavirus (SARS-CoV-2), the pathogen that causes COVID-19, the number goes up and down.
What's more, those numbers are carefully considered when restrictions — and easing of those restrictions — are announced and imposed on the community.
As it turns out, R0 is the key. Policy makers use it when figuring out how soon can people go back to their normal routine: work, school and holidays.
What is an R0?
The basic infection reproduction number is meant to be an indicator of the contagiousness or transmissibility of infectious and parasitic agents.
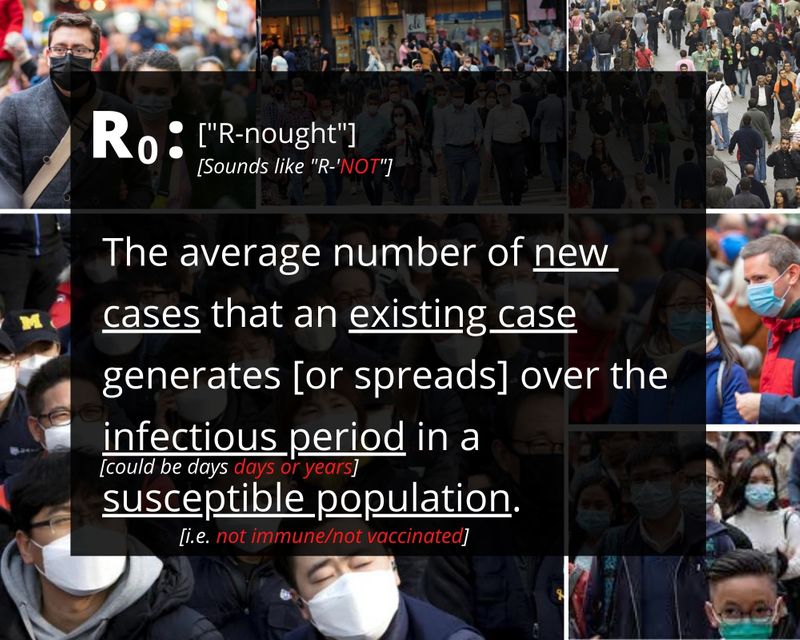
In epidemiology, it’s a common metric used to describe the contagiousness — or "transmissibility" — of pathogens (disease-causing agents like bacteria, viruses).
During an epidemic, R0 refers to the basic reproduction number. It is also called the “basic reproduction ratio” or rate or the “basic reproductive rate”.
Also in the movie "Outbreak" (1995), about a deadly virus carried by a monkey host from the African rain forest, which started infecting the entire population, a handful of scientists struggle to find a cure.

Where did the concept come from?
Demographers first used and introduced the concept of R0, when the metric was used to count offspring.
When R0 was adopted for use by epidemiologists, the objects being counted were infective cases.
What is the formula for computing the R0?
The value for R0 is equivalent to the nuber of new cases over existing cases, according to the Emerging Infectios Diseases journal.
Can you give me a number of scenarios on how I can compute R0?
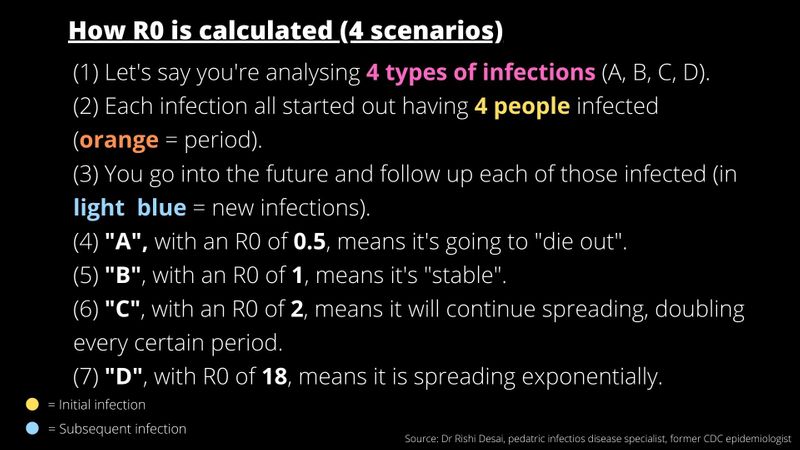
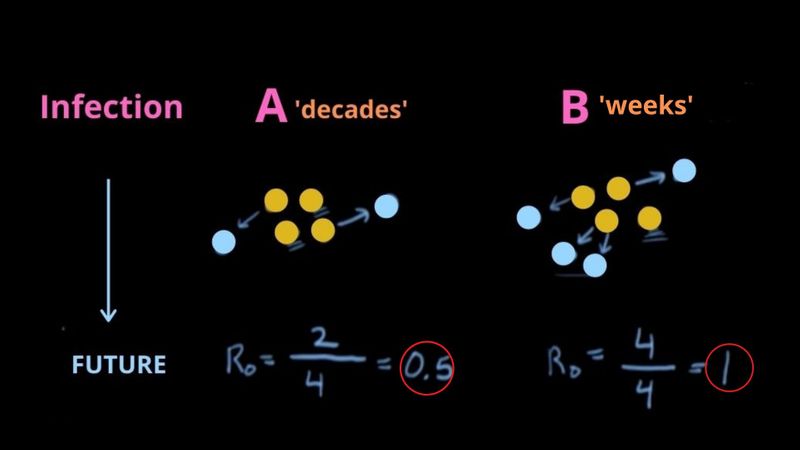
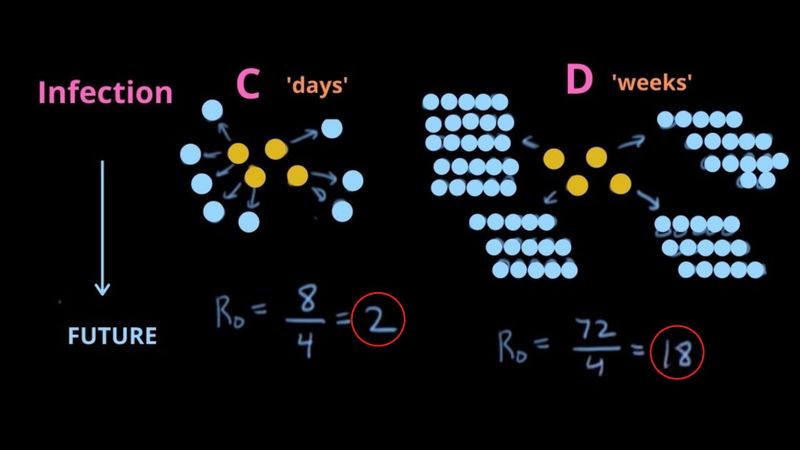
Below is a rather simple example, with four scenarios, provided by a CDC expert.
- Let's say you're analysing 4 types of infections (A, B, C, D).
- Each infection all started out having 4 people infected (orange = period).
- You go into the future and follow up each of those infected (in light blue = new infections).
- A, with an R0 of 0.5, means the epidemic or pandemic is going to "die out".
- B, with an R0 of 1, means it's "stable".
- C, with an R0 of 2, means it will continue spreading, doubling every certain period.
- D, with R0 of 18, means it is spreading exponentially.
(1) Let's say you're analysing 4 types of infections (A, B, C, D).
What are the various factors involved in calculating R0?
The computation of R0 is affected by numerous factors, including:
- Biological;
- Socio-behavioral; and
- Environmental.
These factors govern pathogen transmission. Demographers and bio-statisticians usually estimate R0 with various types of complex mathematical models.
A study published in January 2019 cautioned that due to its complexity — and considering the socio-behavioral, biological and environmental factors involved — R0 is easily "misrepresented, misinterpreted, and misapplied".
[Source: Emerging Infectious Diseases, https://bit.ly/2RiIjNk]
When is it best to use R0 – what pitfalls need to be considered?
This basic metric is quite useful, but it's far from simple: R0 must be estimated, reported, and applied with great caution, warn experts.
A team led by medical geography specialist Dr. Paul Delamater of the University of North Carolina at Chapel Hill wrote “Complexity of Basic Reproduction Number (R0)” in the Emerging Infectious Diseases journal explaining the pitfalls of R0 calculations. The team explained that "R0 is rarely measured directly".
Moreover, the team stressed that modeling R0 values are dependent on model structures and assumptions which may no longer be valid, especially when considering the relevance or applicabaility of historical data to the present period.
At what point does an outbreak continue, or stop?
Because the R0 for an infectious disease event is generally reported as a single numeric value (or low–high range), an interpretation of R0 is typically presented as straightforward.
So for example, an outbreak is expected to continue if R0 has a value >1 (greater than 1) — and to end if R0 is <1 (less than 1).
The potential size of an outbreak — epidemic/pandemic — often is based on the magnitude of the R0 value for that event. The graph below shows the R0 for different infectious diseases. The farther to the right you go, the higher the infectiousness/contagiousness. The higher you go, the high the mortality rate.
R0 values have been published for measles, polio, influenza, Ebola virus disease, HIV disease, a diversity of vector-borne infectious diseases, and many other communicable diseases.
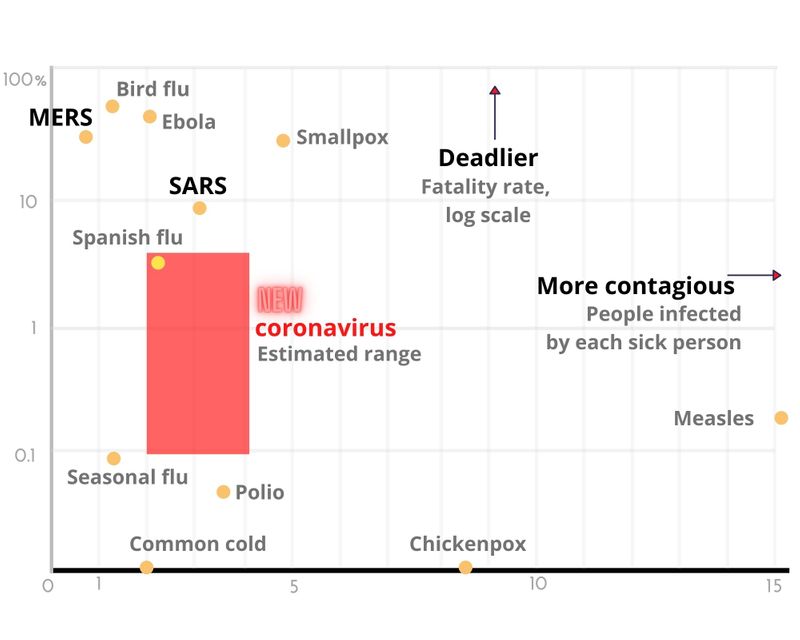
R0 can also be used to estimate the proportion of the population that must be vaccinated to eliminate an infection from that population.
R0 values have been published for measles, polio, influenza, Ebola virus disease, HIV disease, a diversity of vector-borne infectious diseases, and many other communicable diseases.
Why is it difficult to determine R0?
On the surface, R0 looks quite simple to calculate. But the models used in guiding the estimates must use exhaustive scientific measures. And this is the difficuylt part. Most of the R0 estimates almost always are based retrospectively from seroepidemiologic data or by using theoretical mathematical models.
Data-driven approaches include the use of the number of susceptible persons, average age at infection, final size equation, and intrinsic growth rate.
When mathematical models are used, R0 values are often estimated by using ordinary differential equations. This makes high-quality data rarely available for all components of the model.
Often estimated values of R0 generated by mathematical models are dependent on numerous decisions made by the modeler. This is further complicated by
The following critical model parameters and sub-parameters must also be considered, such as:
- Population structure;
- Susceptible-infectious-recovered model;
- Susceptible-exposed-infectious-recovered model;
- Persons who are exposed but not yet infectious;
- Assumptions about demographic dynamics (e.g., births, deaths, and migration over time)
Other decisions include whether to use a deterministic (yielding the same outcomes each time the model is run) or stochastic (generating a distribution of likely outcomes on the basis of variations in the inputs) approach.
An important point cited by Delameter's team: Some of the R0 values commonly reported in the literature for past epidemics (might not be valid for outbreaks of the same infectious disease today.
Is it possible to get the true values for R0?
Delamater's team pointed out that many of the parameters included in the models used to estimate R0 are merely "educated guesses".
"The true values are often unknown or difficult or impossible to measure directly," they stated.
Experts say that in order to match the present-day epidemiologic reality, the calculation of the R0 must take into account the following:
- Changes that have occurred in how humans organise themselves both socially and geographically (including ability to do mass vaccine tests through cloud-based enrollment)
- Human behaviour: behavioral changes that alter contact rates (to determine effective contact rates); and
- Biological characteristics of pathogen (duration of contagiousness).
Takeaways:
- References to R0 data acquired during 1912–1928 (US), or 1944-1949 (UK) for measles), or 1908-1917 (US) and 1944-1979 (UK) for pertussis, need to be updated given present-day realities.
- Behavioral changes alter contact rates, and it's a key component of R0 calculations.
- Modern data must be considered in calculating R0, even if they fall outside the range of previous estimates based on old data.
- The same modeling assumptions must be used in calculating contagiousness of different historic, emerging, and reemerging infectious agents.
R0 data acquired during 1912–1928 need


