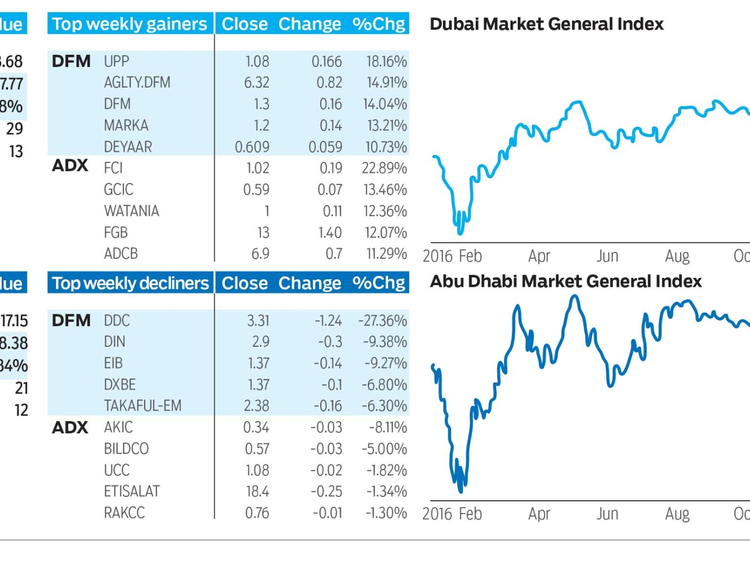
Dubai: The Dubai Financial Market General Index (DFMGI) burst higher last week, rising 197.77 or 5.88 per cent to close at 3,558.68. That’s the strongest one-week gain since early-February, and the type of enthusiasm one would like to see if the index is going to have a chance of exceeding the 2016 high within the foreseeable future. There were 29 advancing issues and 13 declining, while volume rose to the fourth highest level of the past year.
As noted in previous weeks the DFMGI has been consolidating within a rectangle formation for the past six months or so. It last hit the bottom of the rectangle four weeks ago at 3,195.49. As of last week’s high of 3,559.80 the index was up 11.4 per cent from that low.
A rectangle consolidation pattern that forms following a prior consistent rally is considered a bullish trend continuation pattern. The rally in the DFMGI that preceded the rectangle pattern began from the January bottom at 2,590.72, and ended at 3,604.70 fourteen weeks later. That’s a 39.1 per cent advance and can be considered the first leg up in the uptrend. If we see a decisive rally and daily close above the 2016 high of 3.623.70 a bullish breakout of the rectangle will be triggered. After that we need to see additional signs of strength to confirm the upside potential of the breakout. Nevertheless, given the power of the rally before consolidation, the potential is there.
The first target for the index subsequent to a breakout is 3,739. Keep in mind that since the rectangle formed over a number of months the implications of a breakout, if it does occur, are longer term.
Further supporting the bullish potential for the DFMGI is recent price behaviour in regards to the long-term downtrend line. That line represents resistance when price is below it and support when price is above it. The first long-term bullish implications were given as the index moved decisively above the line in July and continued to strengthen. Subsequently, resistance was seen at a new 2016 high and the index moved into a retracement culminating at the low four weeks ago. What’s significant and bullish, given the subsequent price reaction, is that the recent low found support right at the downtrend line. In other words, previous resistance (represented by the line) has been tested as support and price was rejected culminating in a powerful move higher. That’s very bullish behaviour and improves the odds for an eventual move above the 2016 high.
Until then last week’s high hit the beginning of a resistance zone that goes up the top of the rectangle at 3,623.7. Given the bullish implications on investor sentiment given last week’s strength pullbacks could be minor as buyers start to come into the market more aggressively in anticipation of a move above the 2016 high.
Abu Dhabi
Last week the Abu Dhabi Securities Exchange General Index (ADI) advanced by 208.38 or 4.84 per cent to close at 4,517.15, its best performance since early-February. A bullish breakout of the seven-week consolidation range discussed in previous columns was triggered and led to the rapid advance. There were 21 advancing issues and 12 declining, while volume jumped to a two-week high.
The long-term bullish implications for the ADI have similarities to the analysis of the DFMGI. During the first quarter of this year the ADI had advanced 24.3 per cent over thirteen weeks. Subsequently, as of the 4,179.13 low hit four weeks ago a large rectangle consolidation pattern has formed on the price chart. As of last week’s high of 4,518.71 the ADI was up 8.1 per cent from that low.
Resistance near the top of the rectangle starts around 4,583 and goes up to the 2016 high at 4,637.24. A bullish breakout is triggered on a daily close above the 2016 high. At that point the ADI would next be heading towards 4,723, followed by the July 2015 peak at 4,902.
The situation is a little different than Dubai in regards to the long-term downtrend line. In July the ADI moved above the line and stayed there for only a month or so before falling back below it. In other words the line almost immediately continued to act as a zone of resistance. However, last week’s rally put the index back above its long-term downtrend line and the index closed above it on both a daily and weekly basis. This on its own provides a new intermediate to long-term bullish signal.
Stocks to watch
At this point a good number of stocks are extended to the upside and at risk of a retracement. This makes it difficult to find proper entries with good reward relative to risk. Keep this in mind when looking to protect profits as well.
As the index jumped last week some of the previous market leaders were already in a pull back. Until proven otherwise by the price action we can anticipate that the leaders will continue to lead. They deserve to be watched in preparation of an eventual continuation of their uptrends. Some of the leaders include Shuaa Capital (up 264.5 per cent year-to-date), Gulf Navigation (up 159.7 per cent year-to-date), National Central Cooling (up 70.8 per cent year-to-date), and Union Properties (up 45.6 per cent year-to-date).
Bruce Powers, CMT, is chief technical analyst at www.MarketsToday.net. He is based in Dubai.


