Luxury is high on the spending priorities of GCC visitors to the UAE
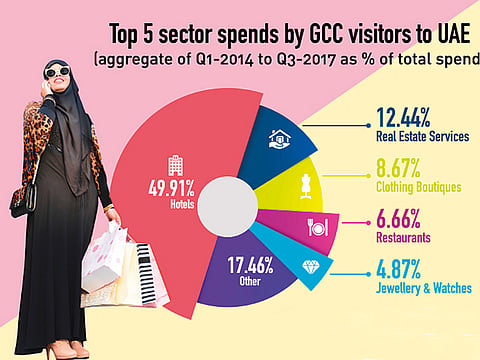
Largest GCC tourist spend by far has been on hotels over the past four years
Dubai
The UAE’s retail sector has a synergistic relationship with tourism — visitors seek out the country for its variegated shopping options and the retail sector’s growth is closely tied to visitor spend. Due to ease of movement, proximity and other factors, tourists from the GCC not only comprise one of the largest groups but are also regular visitors throughout the year, cushioning retailers against seasonal spend seen by other groups of tourists.
Consequently, one of the questions is asked most often in my regular interactions with merchants as well as card issuing institutions is this: “What are tourists — especially those from the UAE’s five GCC neighbours — spending on when they come to our country for a holiday or on business?”
That’s a really good question, primarily because official data show that GCC visitors to Dubai alone constituted the largest chunk of tourists at 23 per cent, followed by visitors from Western Europe at 21 per cent. Dubai Tourism’s data is bolstered by industry numbers that show that GCC visitors to the UAE are also by far one of the largest aggregate spenders.
Such insight may be valuable on a surface level, but a large retail conglomerate, for instance, needs deep-dive data that not only shows what the Khaleeji visitor is spending the most on, but also reveals how this compares to granular spending by other regional groupings.
Being the largest processor of all types of payments — from debit, credit, and prepaid cards to e-commerce — Network International is best positioned to answer these questions. So, I requested the Network data scientists to pull the relevant numbers out of our data centre, and spent some quality time playing with multiple Excel sheets.
While the discoveries may not shake the foundations of the UAE’s tourism sector, they do provide a little more than surface insight. Let’s start with some observations that might lead to obvious conclusions, before we dive deeper into the data relationships.
GCC tops the spending league
For one thing, GCC tourists are the second largest spenders after visitors from Europe. However, that’s because we include Russia in the Europe grouping, using the United Nations Geoscheme as the foundation. If we exclude Russian spend from Europe, GCC becomes the largest spending group of visitors to the UAE, driven mainly by Saudi tourists.
Let’s now delve a little deeper into the sectors which receive the maximum benefit from spending by Khaleeji visitors to the UAE. The pie chart accompanying this article makes it very clear that the largest GCC tourist spend by far has been on hotels over the past four years, followed by real estate services, clothing boutiques, restaurants, and jewellery and watches.
This gives us room to speculate about the propensities of GCC visitors while also giving mall owners, for instance, invaluable data about how to structure their retail mix. Clearly, most of the spending is going into discretionary luxury goods and services. The only stand-out here is real estate services, such as facility management companies, which are benefiting from the massive property investments made by GCC investors in the UAE.
In almost every one of these sectors, as the data over the past four years show, the GCC grouping of visitors is the top spender, followed by visitors from Europe. North American visitors appear to love bling so much that they constitute the largest spend in the jewellery and watches sector overall, followed by the Khaleejis and the East Asians, with Europe coming in fourth.
The North Americans also come in a close third as spenders on restaurants, hotels, and clothing boutiques, behind the Europeans.
East Asian are growing fast
East Asians, while still remaining in fourth and fifth places in most sectors, have emerged as one of the fastest growing spending groups in 2017, led by lavish spending via Chinese cards. Chinese visitor spend in the UAE has grown by 15 per cent in the first quarter of 2017 compared to the same quarter in the previous year. Similar year-on-year growth numbers for the second and third quarters has been 30 per cent and 42 per cent — an accelerating trend that needs to be factored into the UAE’s retail and tourism strategies for 2018.
And what exactly have the Chinese been spending on in 2017 so far?
Like the North Americans, the Chinese seem to love spending on wearable bling, with jewellery and watches being at the top of their list in the first three quarters of 2017, but still behind cards issued in the United States. This is followed by outlays on hotels, cosmetics, clothing boutiques, and real estate services.
Of course, we understand that listing the top spending sectors for visitors from the various regional groupings would also be hugely affected by the actual values of the goods and services being purchased, and this should be factored into our understanding of who is spending how much on what.
On the other hand, the combination of purchase value and spend propensity is a good way to understand how much visitors from the various regions of the world are contributing to the UAE’s overall GDP. This, in turn, helps to fine-tune and consolidate the nation’s strategy related to tourism blend and marketing, by bolstering the sectors that are working well while strengthening those that may be straggling.
Note: The data used does not include cash transactions, nor does it cover 100 per cent of card transactions in the UAE. It is not adjusted for inflation. Geographic breakdown is based on the country in which the card was issued and may not represent the spender’s nationality or residency.
Samer Soliman is Network International’s Managing Director, Group Acquiring.


