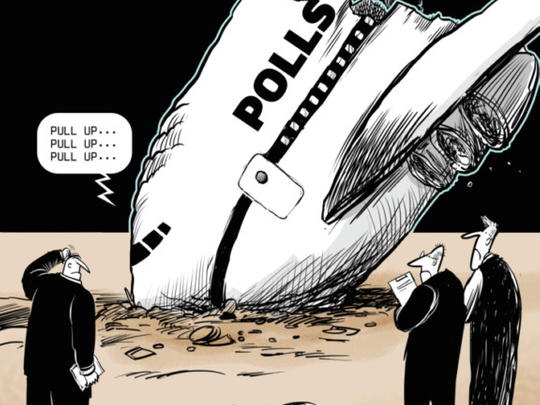
Planes rarely crash because one instrument fails or one gauge gives a bad reading. Rather, the right combination of things fail in tandem — a mechanical problem paired with bad weather, a backup system malfunctioning at the same time as a pilot error — leading to catastrophe. The shock of the 2016 American presidential election forecasts is not dissimilar, with a series of mistakes building upon one another to lead prognosticators astray. Pollsters now are sifting through the wreckage to find the black boxes and assess what went wrong in order to prevent it from happening again.
The good news is that at the same moment, polling feels a bit broken, there are new tools available for measuring the mood of the people, the tides of public opinion and the swings of an election. These tools — including precise demographic models and social-media data — shouldn’t replace polling. But they could help refine our predictions and our understanding.
Despite America’s surprise at Donald Trump’s victory in the presidential election, not all polls failed in 2016. The American national polling average will probably be fairly close to the final popular-vote result once all the remaining ballots in California are counted. And polls in some states, including New Hampshire and Virginia, got the election almost exactly right. But polls were off in enough other states by large enough magnitudes to mislead forecasters about which states were in play and which way the electoral college would go.
Some analysts have suggested that “shy Trump voters” were afraid to admit their true preference to pollsters, but it is not clear why this would cause Trump to dramatically outperform his poll numbers in some swing states but not others, and it doesn’t explain why Republican Senate candidates often outperformed their polls by similar margins. There is some evidence for the theory that pollsters’ turnout assumptions were off and that the electorate was simply more Republican across the board, with turnout rising the most in heavily Republican counties and dropping the most among a core Democratic constituency: African-Americans. Polls can also err because of late movement heading into Election Day, especially in an election with historically high numbers of undecided and third-party voters. A possible clue here lies in the exit polls, which showed late-deciding voters in those decisive Rust Belt states breaking heavily for Trump.
Nate Silver of FiveThirtyEight managed to outperform his peers by assuming that the polls might not be as good as people thought and, as a result, believing there were more possible paths to a Trump victory. But to always assume that the polls might be “off” is not a very satisfying way to address the problem.
Rebuilding trust in polling is key, as polls not only help politicians win elections but also offer a valuable way to tell those in “the Beltway bubble” what their constituents are thinking.
In the worlds of polling and data analytics, there should be a reassessment of how we can accurately determine who is likely to vote. Relying on vote-history data from voter files, rather than often-erroneous self-reports of voting history, is an essential element missing in most media polling. But leaning too heavily on data from previous elections can lead us to miss what’s different about this one. For instance, it wasn’t a given that Democratic candidate Hillary Clinton would be able to reenergise the Barack Obama coalition. Meanwhile, conventional likely-voter “screens” — the way pollsters try to filter out nonvoters and improve the representation of actual voters in a sample — have failed in two election cycles in a row, giving Republicans false hope in 2012 and doing the same for Democrats in 2016.
We also may need to look beyond polls alone for answers. Just as you shouldn’t fly a plane until multiple systems are checked and rechecked, we shouldn’t rely on polls alone to tell us how we’re doing. Indeed, there were signs this year that the Democrats’ electoral map was more fragile than the polls made it appear to be.
While the polls gave conflicting signals about the state of play in the upper Midwest — showing Iowa and Ohio leaning towards Trump, and Michigan and Wisconsin towards Clinton — demographically, these states are not very different, each having a comparatively high share of white voters without college degrees. Demographic modelling by the likes of David Wasserman of the Cook Political Report provided a more accurate view, showing the Rust Belt poised to move solidly towards Trump. Nationally, America’s own demographic model, relying on factors such as the percentage of white voters without college degrees, outperformed state polling averages in anticipating which states Trump had a chance of flipping on his way to an electoral college upset.
We can learn from the digital world, too. One shortcoming of polls is that they can be slow to reflect reactions to fast-moving events, particularly in the final days before an election. Using real-time digital data to derive these insights is intriguing, yet top-line figures such as numbers of searches or mentions are rarely illuminating. In fact, our own analysis of publicly available Google trends found that these measures tended to be negatively correlated with candidate performance. In the 30 days before the election, “Donald Trump” was Googled more in states that he lost than in those he won.
It’s digging to understand exactly who is talking about the candidates where things get interesting. Throughout the election, we tracked conversations among thousands of partisans on Twitter to gauge which side seemed more interested and enthusiastic at any given moment. The data in the last few weeks was revealing: The volume of liberal attacks on Trump began to decline around the time of the final debate, while conservatives continued to ratchet up the pressure on Clinton heading into Election Day. This reflected a dynamic in which Clinton was fending off a potentially rekindled FBI investigation, while Trump was behaving more like a normal Republican nominee. Was flagging liberal interest in attacking Trump a possible indicator that Democrats might not surge to the polls the way they did in 2008 and 2012? While we should generally be sceptical of enthusiasm metrics — from yard signs to crowd sizes — the ability to rigorously quantify partisan energy levels in online conversations could help answer that elusive question: Who is likely to vote?
Positive online energy, too, may have been an indicator. Media consultant Erin Pettigrew examined Facebook interest in the candidates, finding that it beat polling in predicting the outcome in some states, including Pennsylvania and Michigan. Overall, this Facebook data did not outperform all the state polls, but when combined with the polls, we found that it gave a more accurate forecast of the electoral college than the polls on their own.
Electoral surprises around the globe — from Trump to Brexit — show that we may be overly reliant on horse-race polling. But opinion polls are useful for what they tell us beyond who will win the election. Many of the attitudes Trump rallied voters around (discontent with the status quo and mistrust of political and economic elites) were popular in polls, even when he wasn’t. This may have been a harbinger of his success and a clue as to where voters would eventually gravitate. The growing availability of data, from digital and traditional sources, and the ability to analyse it mean we now have more than just polls to understand the electorate.
— Washington Post
Kristen Soltis Anderson and Patrick Ruffini are co-founders of the Republican research firm Echelon Insights.


