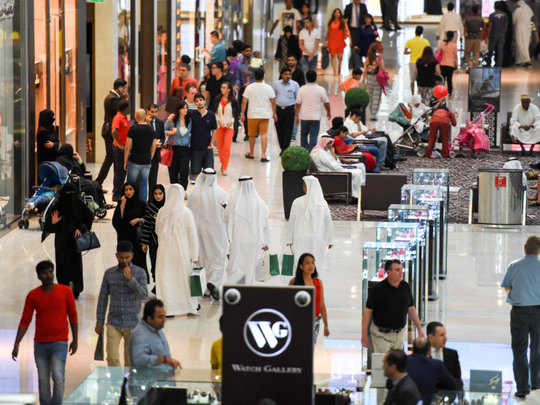
Everyone will agree I’m sure, that anecdotal evidence exists to indicate that the residents of the UAE love to live large, especially when it comes to spending. Who among us does not like to travel, get the latest gizmos, wear the best clothes and accessories, and eat out with family and friends on a nice balmy evening.
Often, the other edge of the anecdotal sword can be negative news about the performance of the economy or of particular sectors.
But now there is hard evidence — based on the numbers being crunched by Network International’s data boffins — that UAE residents, unlike visitors from other countries, continue to spend come rain or shine.
The spend may increase in one sector while decreasing in another, but, regardless of anecdotal information, it continues to rise in aggregate.
Quarterly data show that for the past three years, spending on cards issued in the UAE has increased inexorably year-on-year, at a stable and steady pace. In fact, the past three quarters — from October 2016 to June 2017 – have kicked that rate of growth into a higher gear, as the chart shows.
Increasing financial nous in the UAE has also resulted in a steady shift of cash transactions — including small ones at the neighbourhood grocery — to plastic. This too has ensured a steady increase in card spends in the country.
Data is a strange animal that usually requires careful handling. Not only does one need to be confident of its veracity, but also be certain that it is relevant to the specific zeitgeist of its geographic origins.
Let me put that another way. The data I’m looking at has been collated by the UAE’s largest provider of payment solutions — Network International, which handles around half of the overall card payments made in the UAE; making the data credible.
At the same time, I am comparing a quarterly period to the same three-month period in the previous year, because I understand that, in a socio-economic sense, every quarter in the UAE is different from the one that precedes or follows it. We know for a fact that aggregate spending in the UAE may move up and down depending on the time of year. It is therefore much more valid to compare a quarter to its counterpart in the previous year.
As a payments major providing services across 55 countries to more than 200 banks as clients and more than 70,000 merchants across the Middle East and Africa, it is Network’s job to keep track of the geopolitical realities in each of the locations in which we provide services.
That’s the crossroads where data meets information to create decision-enabling intelligence.
The data also shows that, while there is a continuous increase every quarter (year-on-year, not compared to the preceding quarter) in UAE spend, the second and third quarters display a slightly lower rate of growth. Now, we know that Q2 and Q3 include the summer doldrums, in spite of which the spending maintains its growth track. As more and more cash spend is converted to card spend in the UAE, this growth is likely to continue. We can attribute the continuous growth to the fact that only 40 per cent of transactions in the UAE are card-based and more cash transactions are being converted to card.
The UAE’s growing population of resident spenders is also contributing to the unremitting upward trend. In developed economies, card transactions tend to be between 60 per cent and 70 per cent.
Let’s approach this whole business of spend stability from another data angle. Stability of spending can also be gauged by the differential between the lowest monthly spend and the highest monthly spend in any given year, or 12-month period. Expressed as a percentage (sometimes as a ratio), a lower number indicates a small difference between high and low spends, again pointing to a higher degree of spend stability.
Network’s data show that in 2016, for instance, the spend stability differential for UAE-issued cards was 26.97 per cent, compared to a large swing of 274.62 per cent for Saudi-issued cards and a massive 781.05 per cent swing for Russia-issued cards. What’s more, the differential for UAE-issued cards has remained in a +/- 10 band for the past three years.
Among the countries that were the top five spenders in 2016, the UAE’s spend differential is the lowest, indicating the highest degree of spend stability. The next most stable was spending via US-issued cards, with a differential of 50.35 per cent, followed by UK-issued cards with 89.27 per cent.
Again, examining other data points shows that the Russian rouble came under severe pressure at key tourist season periods of 2016, shattering its spending power and resulting in a lower inflow of tourists from that country into the UAE.
On the other hand, Network’s data show that Saudi spending maintains its high spend differential across years, pointing to a clear trend of variation in tourist numbers at various times of the year. This raises the possibility of focused bursts of destination marketing at the low season points in the year identified by the data.
As a key entity in the country’s financial services landscape, spending data from a payments provider like Network has the potential to be a key component of the overall economic decision-making firmament. Data is the basic building block of everything we do in analytics: the reports we build, the analyses we perform, the decisions we influence, and the optimisations we derive.
As Sir Arthur Conan Doyle’s fictional character Sherlock Holmes said: “Data! Data! Data! I can’t make bricks without clay!”
(The data is not comprehensive or full retail sales data — it does not include cash transactions, nor does it cover 100% of card transactions in the UAE)
— Samer Soliman - Managing Director - Group Acquiring, Network International


