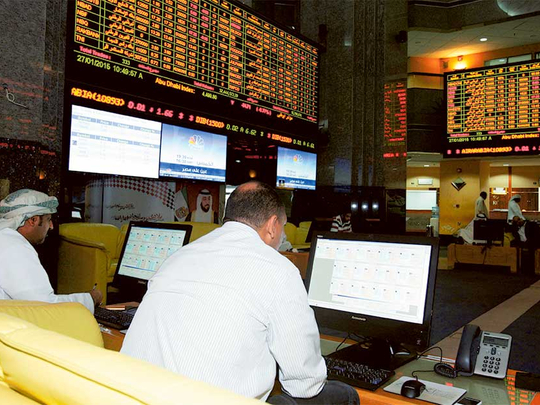
Dubai: Last week the Dubai Financial Market (DFM) General Index was essentially flat, up by 3.80 or 0.13 per cent to end at 2,884.22. However, market breadth seemed more decisive with 18 advancing issues and nine declining, while volume dipped to a three-week low.
Volatility diminished to its lowest level in months when gauged off the week’s range. Last week’s high-to-low range of 2,900.34 to 2,861.58 was very narrow, yet the index managed to close above the high (2,881.76) of the prior week. Short term, this is a sign of strength but more work needs to be done before the DFMGI signals any degree of confidence that it can keep going.
For the past two weeks the index has been contained within the weekly range from three weeks ago. It needs to break out of that range to provide a signal for which direction it might be heading next. So far the nine-month downtrend remains well in place. Nevertheless, the decline has been stalled for the past three weeks as the DFMGI consolidates around the bottom of 2,805.44. A break below that low will signal a continuation of the bearish trend, while a move above the three-week high of 2,805.44 will signal a three-week breakout with further upside likely.
An upside move seems more likely so far given the behaviour of the index in recent weeks. Even so, it would also not be a surprise to see some time go by as the DFMGI consolidates further near the trend bottom before it’s ready to move higher, if it is to do so.
The key price level that needs to be exceeded on the upside to provide greater confidence that a bullish reversal is in place would be a rally above the most recent swing high of 3,109.30, which is a five-week high. That would also signal a move above the monthly June high, an additional bullish sign given that longer time frame patterns carry more weight in technical analysis.
Abu Dhabi
The Abu Dhabi Securities Exchange (ADX) General Index gained 83.81 or 1.82 per cent to close at 4,687.01. That’s the best weekly performance for the index in seven weeks and puts it less than 1.5 per cent away from the June peak and three-year high of 4,740.72. Market breadth was close to even with 17 advancing issues and 14 declining, while volume improved slightly above the prior week.
Last week’s high of 4,700.09 put the ADX 4.6 per cent above the most recent swing low of 4,494 from four weeks ago. It remains to be seen whether the bullish momentum of the past several weeks can continue long enough to push through the June peak. That peak was a breakout above the prior multi-year high but it didn’t last long (two days) before resistance was seen and a pullback began.
If a decisive breakout occurs above the June one, it would be a potentially significant accomplishment for the ADX, providing a new bullish trend continuation signal and sending the index up towards the next target around the July 2015 peak of 5,233. Of course, any breakout needs to be followed by additional bullish signals as the index progresses — otherwise the advance is again prone to failure.
Irrespective of the above, last week’s Thursday candle was short-term bearish as the index first went above the prior day’s high but closed below it, the day’s range was narrow, and the opening and close of the day was almost the same. In other words, little progress was made. This type of one-day candlestick pattern can lead to selling if the low of the day (4,672.03) is broken to the downside. If that occurs, watch for support around last week’s low of 4,593.25 or above.
Stocks to watch
Market leader Emaar Properties has been falling for the past 10 months or so, correcting as much as 45.4 per cent off the 5.90 peak as of the most recent lows of 4.89. Three weeks ago Emaar hit 4.89 for the second time in several months and has thereby created the potential for a double-bottom reversal pattern.
Nevertheless, a potential long-term support level has been established at the 4.89 price level. So far the stock has not reversed by much off that support as the ranges of each of the past two weeks are contained within the range of three weeks ago, reflecting uncertainty and consolidation.
If Emaar can get above the most recent daily swing high of 5.16 it has a chance to continue higher and the potential for an eventual breakout of the double-bottom pattern can occur. A breakout of the double bottom will show Emaar’s commitment to a reversal of the multi-month downtrend. However, it has a ways to go (approximately 17.7 per cent) before that would happen as the breakout does not occur until there is a daily close above the three-month high of 5.90. Thereafter, Emaar first targets a potential resistance zone from around 6.36 to the December 2017 peak of 7.06.
In the near-term, the next bullish sign is on a decisive rally above the three-week high of 5.27. At that point Emaar next targets the 5.90 peak. However, in the interim watch for some resistance around 5.39 to 5.43 price zone.
Bruce Powers, CMT, is a technical analyst and global market strategist.


